In my attempt to use Power BI to analyze a little bit of the R universe (if you are interested in this endeavor, you can follow this link). I encountered the following:
There is one dimension table (package) and two fact tables (release and taskviewpackage). The table package basically contains some information about the package, like the name, the author(s) of the package and similar information. I used some R code to scrape this information from the CRAN website.
The table release contains information about the release date of each version of a package, as my project majors I will use this table to extract the update frequency, days passed since the last update and related information. The table Taskviews groups a small amount of the available packages into groups called Taskviews. This grouping can help to find the proper package for ones use cases more easily. Here you can find some additional information about these Task Views: https://cran.r-project.org/
Down below I present three solutions for a certain problem, each with its own pbix sample file, the data contained in the pbix files is just a tiny piece of the data I'm currently using in the above mentioned report.
The basic data model looks like this:

Except the marked columns and the Calendar table everything is created using R script.
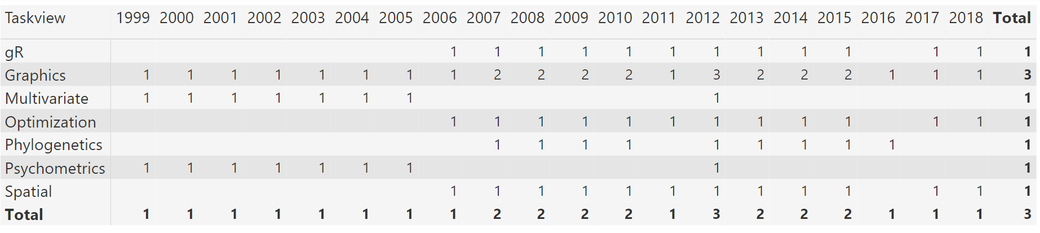
These tables allow to extract information like number of releases and to identify the packages that can be used to answer analytical questions for a specific topic - the Task View. Please be aware that there are packages that are not assigned to a Task View, but are also able to help to answer these questions. So please understand the Task View as a first hint and not as finite list.
The Question
If I want to know how many packages have been assigned to a Task View over time (maybe to get a first impression what's a trend in analytics), I have to combine the tables release and taskviewpackage, but unfortunately I get the following dreaded Error Message: "Can't determine relationships between the fields."

This is due to the fact that Power BI doesn't allow to combine fields from remote tables. I guess the term "remote table" is not used that often, but it helps me to better understand the relationships between table. I call tables remote, if they are not connected by a common table, where the common table is of the many side of the table relationship. Tabular models unleash their analytical power using the concept of Filter Propagation, this is a great whitepapter about this concept "https://powerbi.microsoft.com/en-us/blog/bidirectional-cross-filtering-whitepaper-2/"
Using TREATAS
here you will find the pbix file
Since February 2017 Power BI Desktop has the DAX function TREATAS, this function can be used to create a virtual relationship between the tables. A detailed explanation about virtual relationships can be found here: https://www.sqlbi.com/articles/propagate-filters-using-treatas-in-dax/
The DAX statement to make this happen, looks like this:
No of Package =
CALCULATE(
DISTINCTCOUNT('release'[Package])
,TREATAS(VALUES('taskviewpackage'[Package]),'package'[Package])
)
Personally, I use this explanation for the usage of TREATAS(…)
No of Package =
CALCULATE(
AGGREGATEFUNCTION('<table of interest>'[column])
,TREATAS(VALUES('<remote table>'[Column]),'<table to be filtered>'[Column])
)
I'm interested in the DISTINCT no of packages over time, for this reason I consider the table release as table of interest. The remote table is the table that is not directly connected with my table of interest, the table taskviewpackage. The remote table is used to filter a table, "table to be filtered". This table is either the "table of interest" or is able to propagate its filtered rows to the "table of interest.
This works great, TREATAS(…) creates virtual relationships between remote tables - awesome!
But nevertheless, this solution has its drawbacks:
- Virtual relationships are always slower than a physical relationship
- User of the data model have to be aware, that they have to drag the fields in a certain order to the visual to avoid the error message. First use one "dimension field" or the measure, and then the other fields, the relationship has to be established. This can scare the user away who his not that familiar with the data model
So it could be a good idea to think about the data model and find a way to create a physical relationship, please be aware that this will not be possible in all situations.
Using Multi-valued fields
here you will find the pbix file
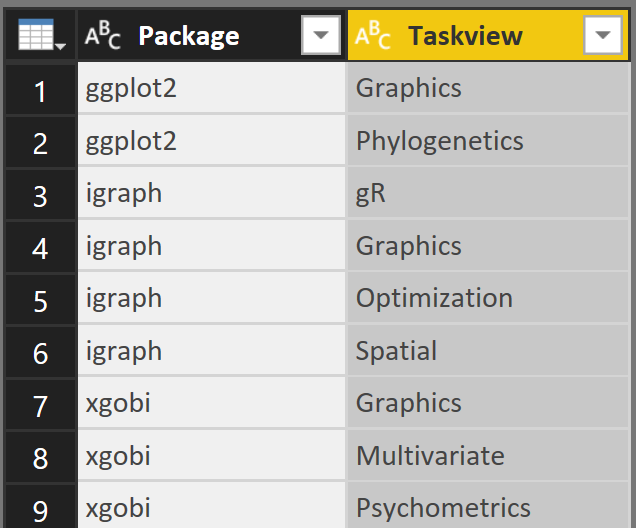
This solution has a slightly different approach instead of using the obvious relationship between the tables package and packagetaskview. I'm creating a phyiscal relationship between the table release and packagetaskview.
To achieve this I'm transforming the original table packagetaskview from this
Into this

The idea behind this is to Merge the Multivalue column into the release table

Then I'm creating two additional tables "taskview multivalue" and "taskview singlevalue".
I'm using these tables to create the final model:

Voila, just physical relationships :-)
Brute force - Creating a Large(r) fact table
here you will find the pbix file
My favorite solution that I'm currently using as the foundation for the Analyze R report is based on a simple Merge of the taskviewpackage column into the table release. This approach multiplies the number of rows in the release table by the number of taskviews for each package.
Basically I'm considering the "duplication" of rows in a fact table as evil, but here I'm relying on
- the blazing fast tabular engine
- the simplicity of the data model
- the "simplicity" of the measures I use, I just have to be aware that I do not count packages more often than I should :-)
The model looks like this:

I use the table taskviewpackage to merge the column Taskview into the release table.
Create a new table by referencing the table packagetaskview, remove the package column and finally I remove duplicate rows.
For now this is my favorite solution!
I hope this post gives you some ideas.
Thanks for reading (this far)
Tom
Kommentar schreiben
100tsky (Samstag, 17 März 2018 08:42)
Thank you
Please check is the file Brute Force.pbix not the copy of the TO TREATAS OR NOT TO TREATAS.pbix
tom (Samstag, 17 März 2018 17:22)
just corrected the link to the bruteforce.pbix, thank you for your patience