Power BI Service · 30. April 2024
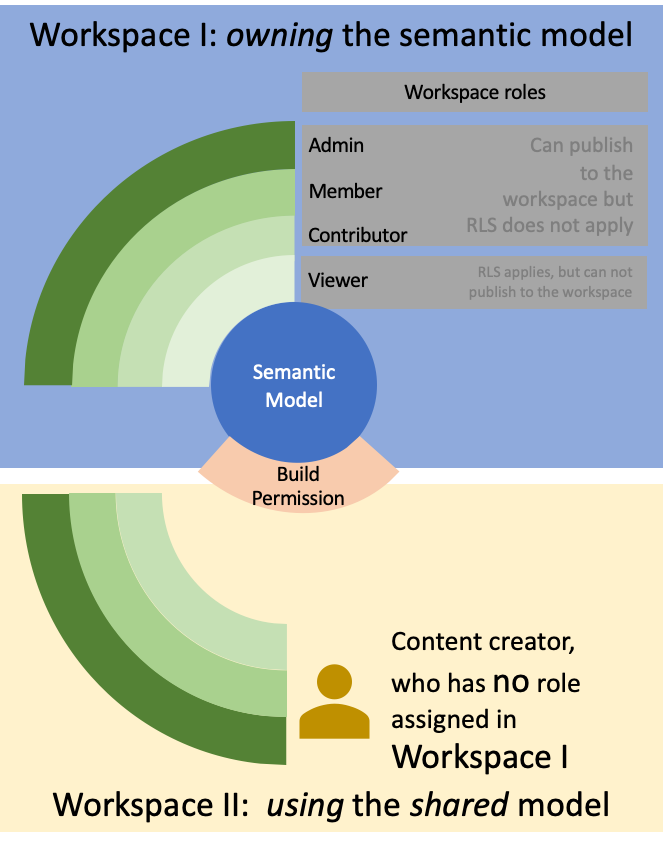
This article is solely about one question: what has to be done if a content creator needs to create and publish Power BI reports, but the content creator is not allowed to see all the data from the semantic model?
DAX · 09. März 2024
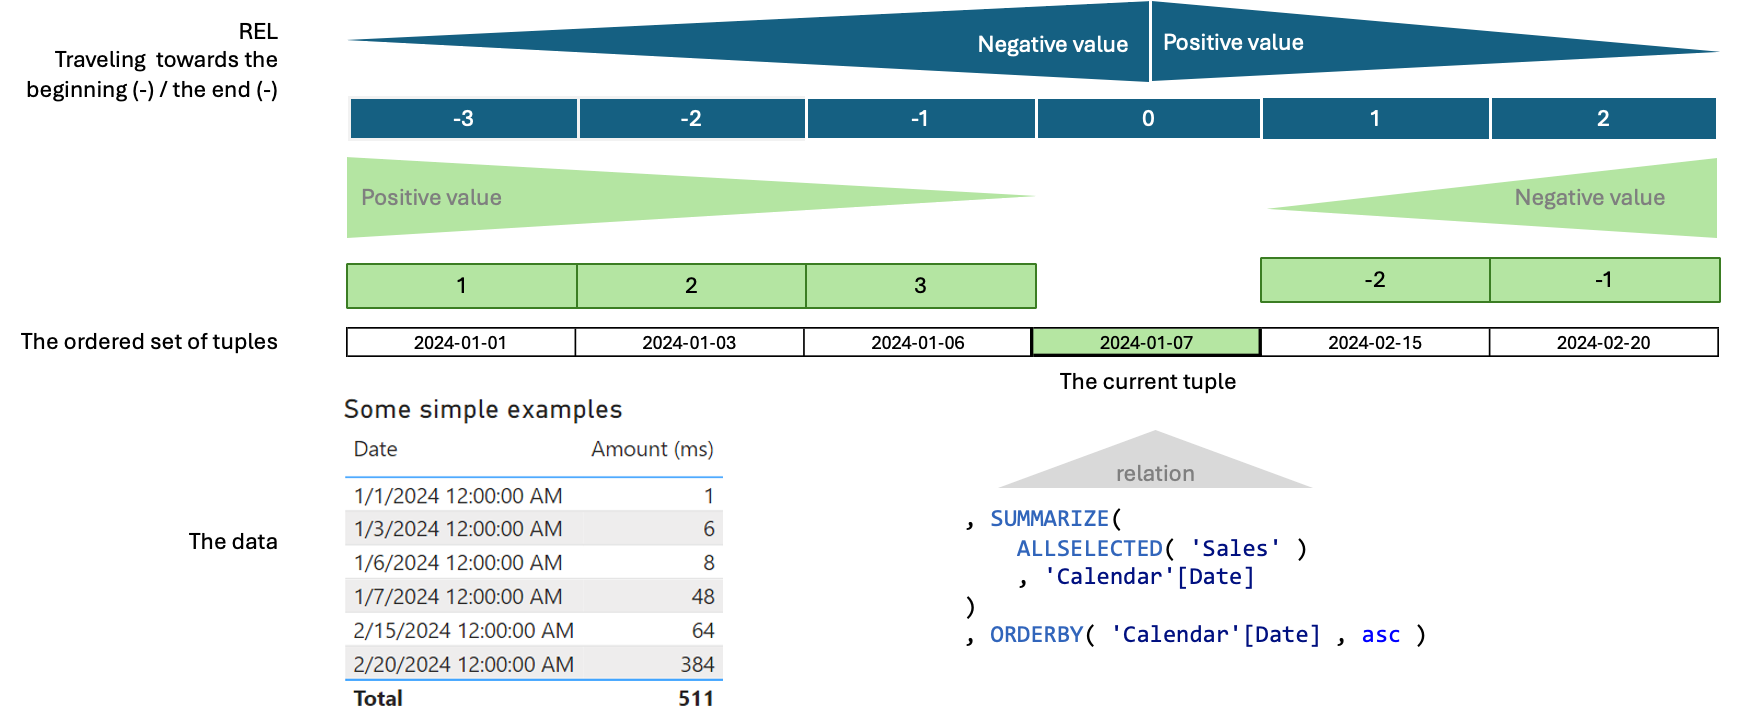
The DAX windowing functions have helped me a lot in tackling complex analytical challenges. Nevertheless, I do not use them daily. This means sometimes I need time to regain the “windowing feel” again. This article will shorten the time until I’m thinking “windowing” again. Maybe it might help you as well.
Data Visualization · 03. März 2024
I think that the combination of the tremendous possibilities of Deneb and Power BI's DAX measures can tackle almost all data visualizations challenges for this reason I lean to Deneb whenever an extra twist is needed in my data visualizations for quite some time.
Microsoft Fabric · 30. Dezember 2023
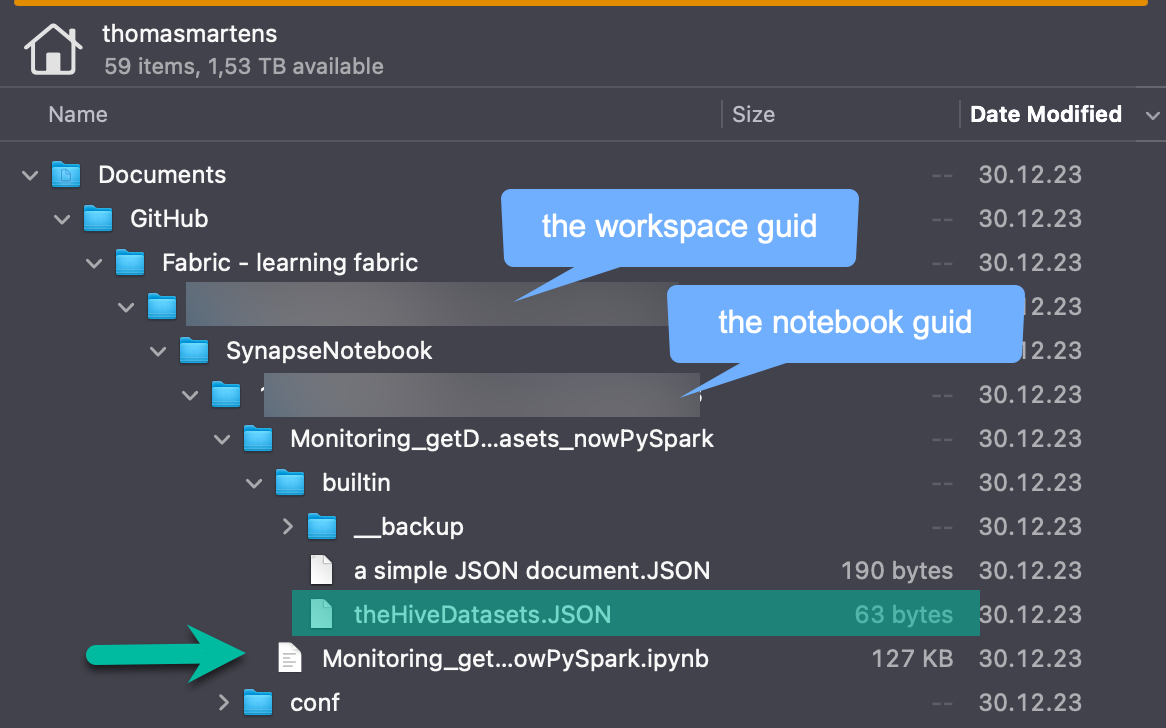
JSON is a straightforward, text-based data-interchange format fully independent of any programming language. This simplicity is why JSON documents have become so widespread.
Often the result of querying a REST API is returned as a JSON document, but this is not the only use case why I consider it important to get familiar with reading from and writing to a JSON file.
Data Visualization · 19. Dezember 2023

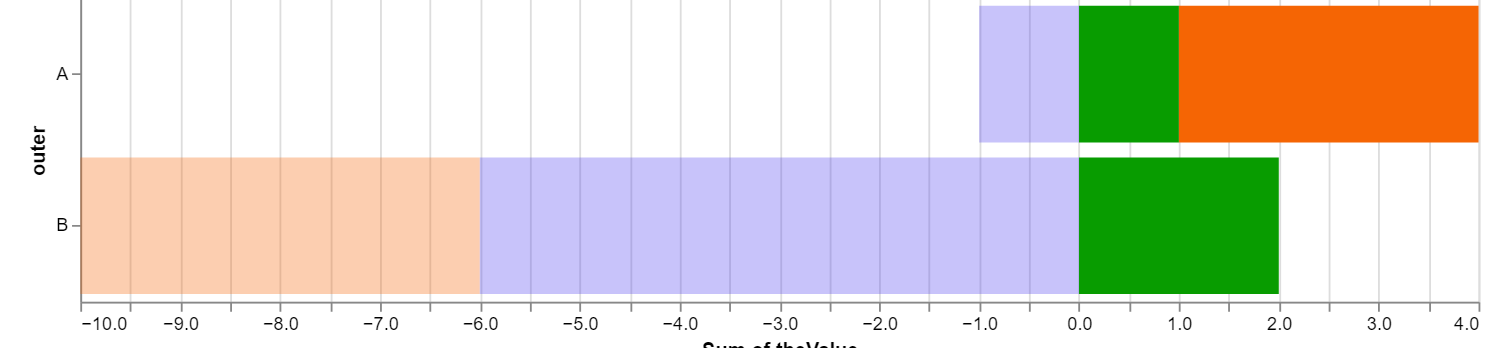
Most of the time, when creating a stacked bar or column chart, my focus is the total value of the stacks, not the comparison of the segments across stacks. Ordering the segments by value still allows us to easily spot differences in the importance of segments across the stacks.
Data Visualization · 12. November 2023
Using Deneb helps to add the visual hints of a pie chart to a stacked bar chart.
Microsoft Fabric · 22. Oktober 2023
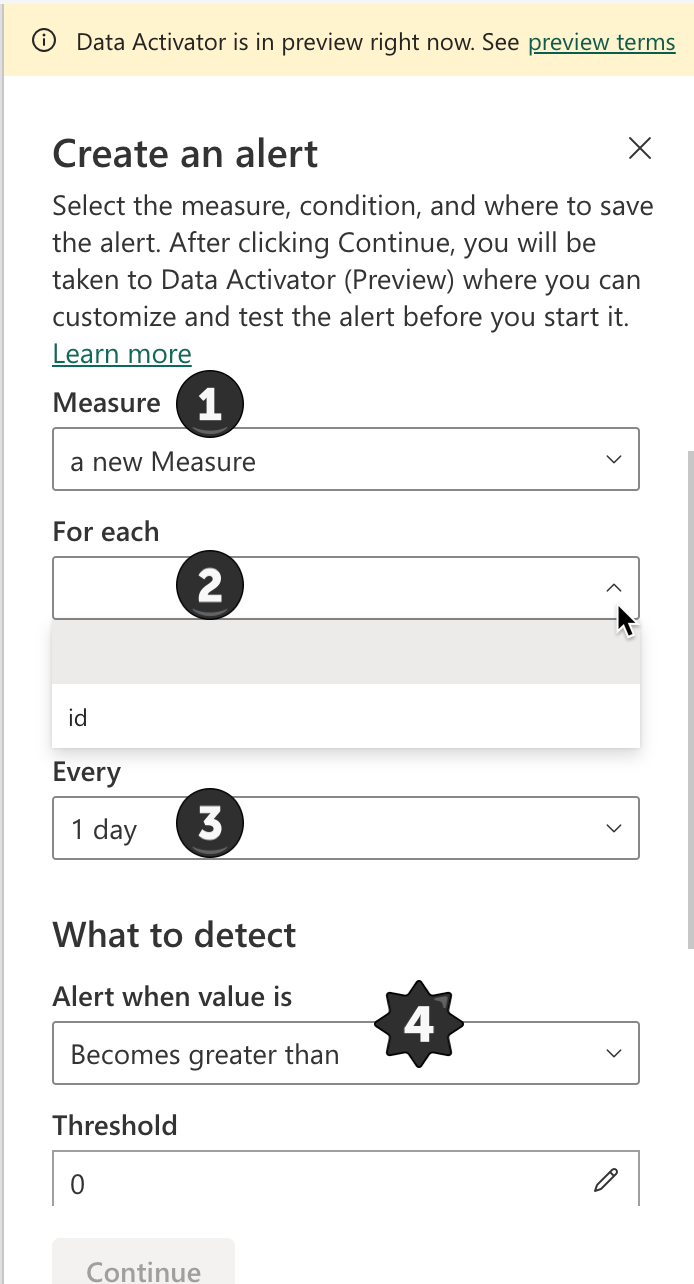
Reflex is many things next to one of the workloads of Microsoft Fabric. Before I delve into these things in more detail in later articles (yes, maybe this is the birth of another series of articles), I want to say this: Reflex is cool. It was never that simple to watch your data in your Power BI datasets (and this is only one of the capabilities of Reflex). Because I need images whenever I try to understand things, I start with a simple image of Reflex: I consider Reflex a watchdog! Reflex is...
Microsoft Fabric · 17. Oktober 2023
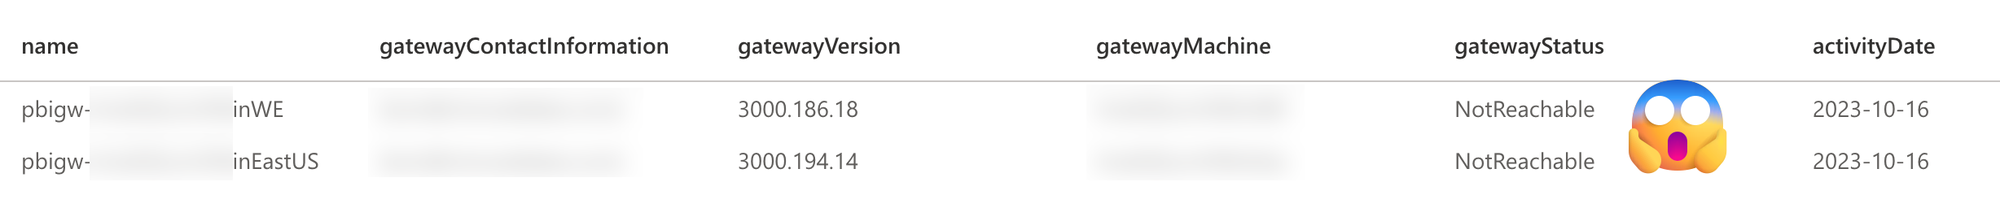
No matter what, when the Power BI on-premises gateways are not working as expected, data will not refresh, and direct query queries will not succeed. It's almost simple to create a monitoring solution using Microsoft Fabric
Data Architecture · 09. Oktober 2023
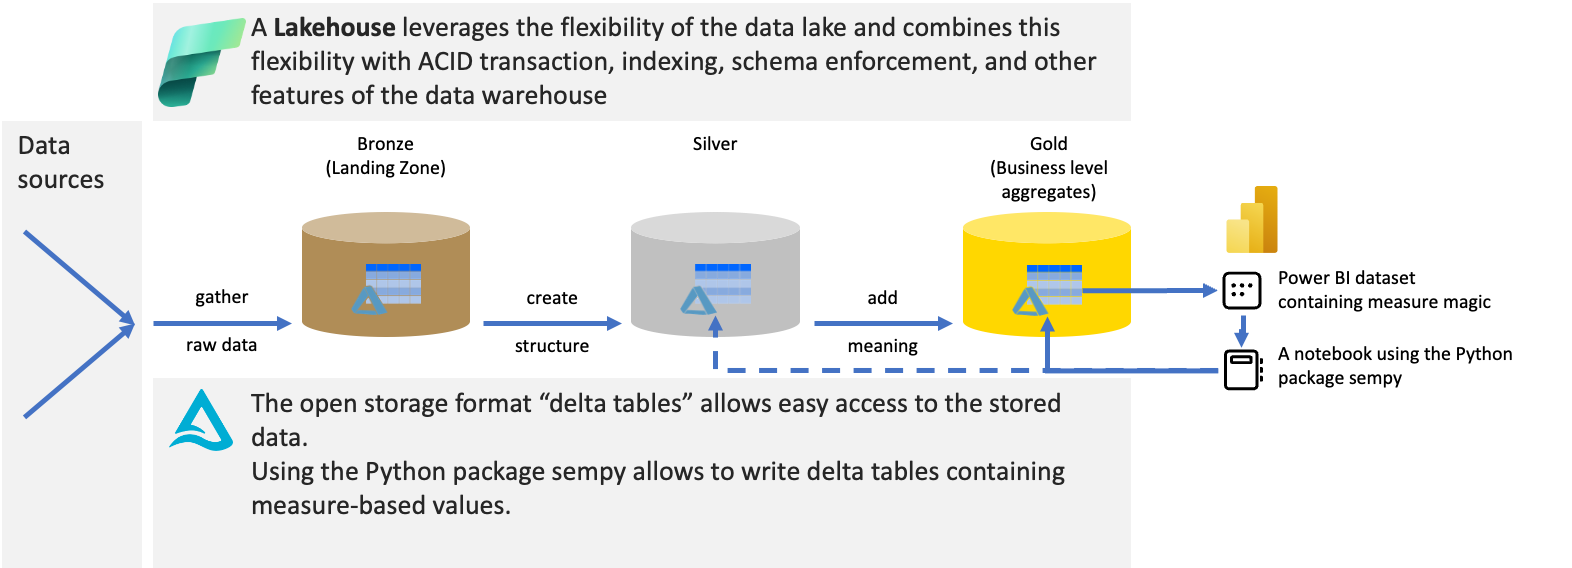
One of the many things I consider epic regarding Microsoft Fabric is the fact that the compute engines that fuel the magic of Fabric have been enabled to read natively from a new storage format. This new storage format is the delta table format (in short, CRUD-enabled parquet files).
Power BI Service · 24. September 2023
I love building Power BI solutions, solutions that help my colleagues make better decisions. I’m very much interested in the overall data architecture and love creating data models that sometimes look like a star, but they often don’t because there are more than six tables 😱. To feed these models with data, sometimes we have to do heavy data massaging, and sometimes we don’t need to. The content creation starts when the model is done (at least for a few months). This last step is often...