One of the many things I consider epic regarding Microsoft Fabric is the fact that the compute engines that fuel the magic of Fabric have been enabled to read natively from a new storage format. This new storage format is the delta table format (in short, CRUD-enabled parquet files).
I do not know since when MSFT’s engineering team(s) are working on the new Direct Lake connection mode for Power BI datasets, I can only imagine that this was/is a very challenging and complex task. And remember, vertipaq (I know, this is not the official name of my or our beloved engine behind Power BI’s datasets) is not the only analytical compute engine that currently reads or will read data from delta tables directly.
If you are wondering what delta tables are, start here: https://delta.io/docs/ This article by my friend Nikola Ilic (aka data-mozart) provides a concise introduction: https://data-mozart.com/parquet-file-format-everything-you-need-to-know/
This article differs from my previous articles as it is not about complex DAX or complicated M code. This article is about an architectural approach we believe (at the current moment) will help us to tame the data deluge: the lakehouse.
Maybe you are already reaping insights from a lakehouse or are planning to implement a lakehouse. No matter what, It’s likely that you came across another term. this term is: medallion architecture. The medallion architecture describes how data is organized inside a lakehouse. When structured data is stored in the open data format delta tables, the lakehouse is called delta lakehouse as well.
The image below visualizes the architectural approach of the lakehouse or the delta lakehouse:
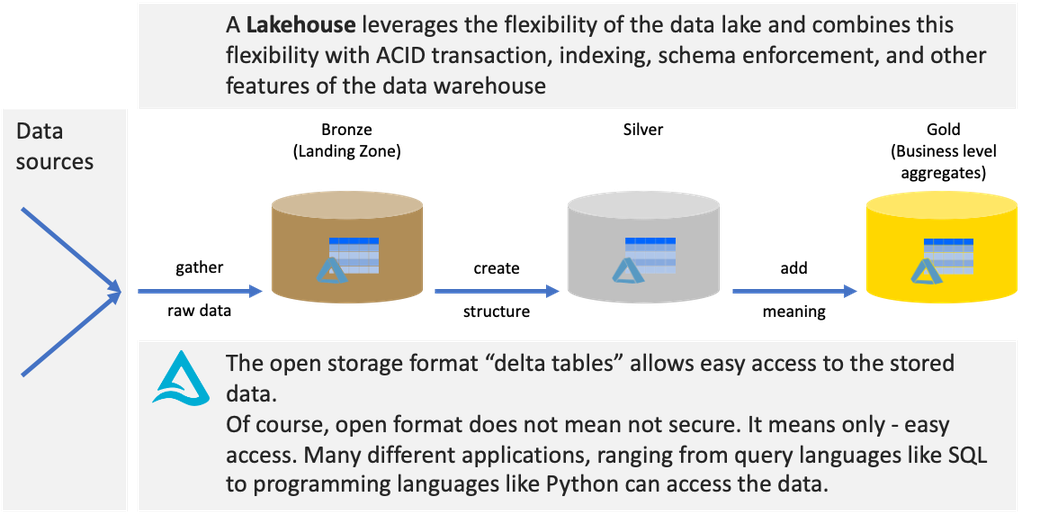
You might think: “Whoa, this is brilliant!” or “Ah, not bad, but not new.” No matter the party you feel more comfortable with, both parties will benefit from this approach to tackle their analytical challenges. I’m meandering between both of these parties.
There is one thing about the Power BI dataset that still gets me excited: the definition of a DAX measure. If you are not familiar with DAX, a measure is calculating a value considering the current context of the user selection. This user selection, in combination with axis labels, row headers, and column headers, is the filter context. A measure automatically adapts to this filter context. If we are talking about tearing down walls, a measure is specific to a Power BI dataset. For this reason, someone can argue that a Power BI dataset represents a data silo even if each Business Intelligence tool that supports the open standard XMLA can connect to a Power BI dataset. If we look closer at the medallion architecture, a Power BI dataset in Microsoft Fabric can be built on top of delta tables inside the gold layer utilizing the new connection mode Direct Lake (https://learn.microsoft.com/en-us/power-bi/enterprise/directlake-overview). Still, values based on measures are unavailable to other tools accessing delta tables. This gap can be closed now 🙂
During the Power Platform Conference in early October 2023, Microsoft announced the public preview of sempy (https://blog.fabric.microsoft.com/en-us/blog/semantic-link-use-fabric-notebooks-and-power-bi-datasets-for-machine-learning-data-validation-and-more?ft=Announcements:category). This Python package allows connecting easily to a Power BI dataset residing in a Fabric-enabled workspace. A workspace that is hosted by a Premium Per Capacity capacity with Fabric workloads enabled or hosted by a dedicated Fabric capacity.
One of the many things we can do using sempy is connecting to a Power BI dataset, executing a DAX query (without needing to be a DAX ninja), and do data engineering magic using our favorite Python packages. We have a data frame when we are done weaving Python magic. If we store the data frame as a delta table, we have measure values available in the gold layer. Of course, we can write to any layer, but I think most of the time, it makes sense to write to the gold layer.
I consider sempy epic because it will blend two worlds into one: the world of Python-based data engineering and data science and the world of Power BI (DAX) based business analytics. The next image shows how these worlds blend into one:
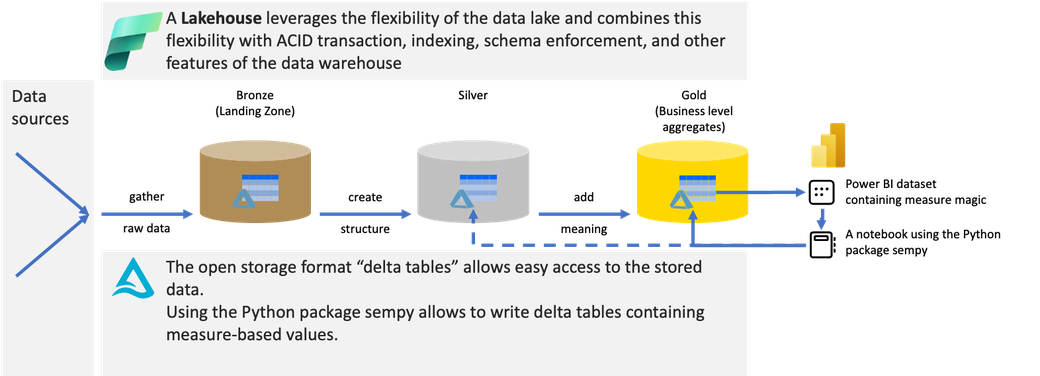
I can use the notebook to write a new delta table or write the result of the DAX query to the files section of the lakehouse using the CSV format. Making data available to Excel was never that easy.
Current dream: create a Power Automate action triggered from inside my Power BI report using the Power Automate visual that is executing a notebook.
Thank you for reading
Kommentar schreiben