Data Modeling
Data Modeling · 24. April 2022
One of the powerful features of the Tabular data model is to extend the model by adding calculated columns and measures. Both objects are defined using DAX, but besides this similarity, they are entirely different beasts. Here you will find guidance when to use what!
Data Modeling · 23. Februar 2022

The concept of extended tables is at the core of the query performance of Power BI datasets, but it is often overlooked. This article will hopefully change this.
Data Modeling · 20. Januar 2022

This article explains provides an introduction to relationships and why relationships can be considered a sword that helps to chop vast amounts of data into tiny pieces.
Data Modeling · 27. Dezember 2021
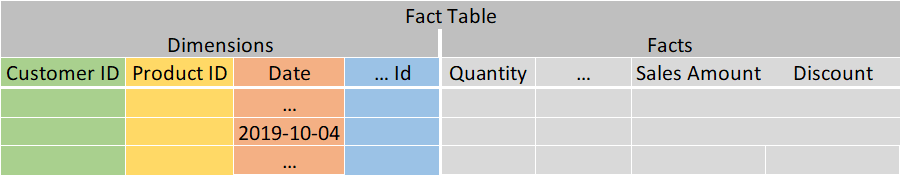
Tables and their columns are the very foundation of Power BI data models.
Data Modeling · 27. Dezember 2021

Data modeling and understanding the physical layer are comparable with being a good driver and a good car mechanic. It's unnecessary to excel in both areas. Still, it helps tremendously when driving an F1 car through uncharted terrain if there is some understanding of how an F1 car works if repair becomes necessary.,
Data Modeling · 07. Dezember 2021
This article has been moved to a new site. You will find the article here.
Data Modeling · 28. Februar 2021

Object Level Security (OLS) helps to protect our data assets inside Power BI. OLS can be applied to a table or just a single column.
Data Modeling · 06. Juni 2018

This post shows how a dynamic member called Other can be used for Data Visualizations in Power BI in addition to the common requirement of the visualization of the TOP N or BOTTOM N members. A solution is used that utilizes a combination of data modeling and DAX.
Data Modeling · 16. März 2018

This post describes approaches how to virtual relationships between tables can be established using the DAX function TREATAS() and also approaches how to create physical relationships instead.