This will become the first post in a series using DAX to create / calculate Groupings and Binnings.
A very common requirement (at least one that I've encountered very often in the recent past) is to show the Top / Bottom N of something. This task can easily be accomplished either by using the Top N setting from within the Visual level filters pane or using the DAX function TOPN.
But as soon as the user also wants to include the remainder, a number that represents the rest, meaning the sum of all the remaining members, this request seems to be overly complex. What the user asks for may look like this:
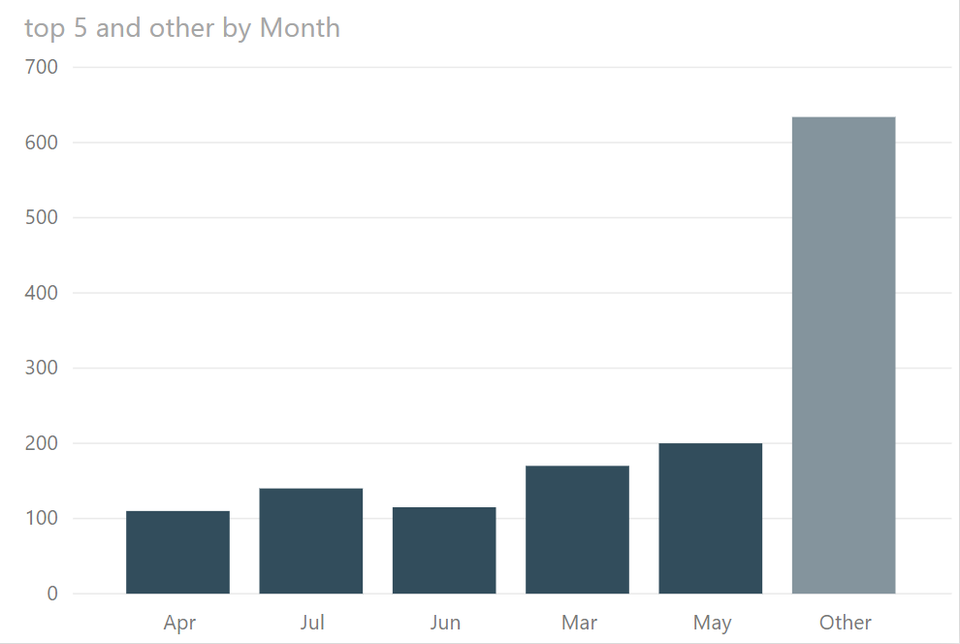
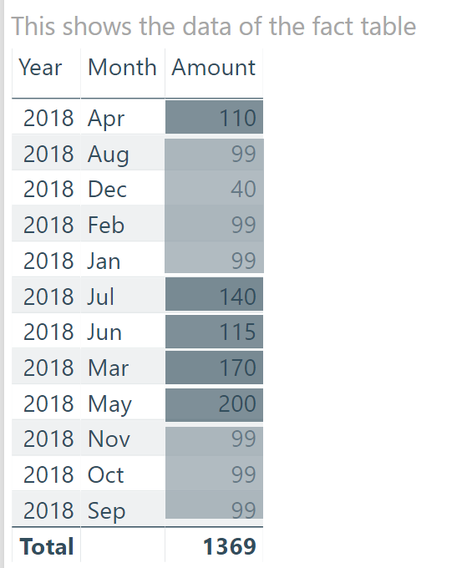
For simplicity I decided to show the top 5 months, here the remainder "Other" is composed by the remaining 7 months. This table shows the underlying data:
Because this is the first post about groupings I want to state some facts that have to be considered to compose a solution for the above mentioned requirement
- only natural columns (originated from tables) and calculated columns (added through tables using DAX)
- Calculated tables are static, meaning that they will not depend on slicer selections or cross filtering, calculated tables will just refresh if the data model is refreshed
For this reason the following challenge has to be solved:
- A dynamic representation for the group member "Other" has to be created
The thinking behind the solution that is preseted is as follows:
- Create an unrelated table that contains all the members of the original table plus an additional member called "Other"
- Find the Top N members (in my example the Months) using the DAX function TOPN(…)
- Calculate the value for the remainder (all the others) using EXCEPT(…)
- Create a table that contains the TOPN and "Other" using UNION(…)
- Iterate over the intersection of the unrelated table and the calculated table
Here is the DAX statement that helps to visualize the remainder:
top 5 and other =
var top5 = CALCULATETABLE(TOPN(5,VALUES(Table1[Month]),CALCULATE(SUM('Table1'[Amount]))))
var other = ROW("Month", "Other")
var allTheRest = CALCULATE(SUM(Table1[Amount]), EXCEPT(VALUES('Table1'[Month]),top5))
var theUnion = UNION(top5,other)
return
SUMX(
INTERSECT('Unrelated',theUnion)
,
var currentIterator = 'Unrelated'[Month]
return
IF(
'Unrelated'[Month] <> "Other"
,CALCULATE(
SUM('Table1'[Amount])
,'Table1'[Month] = currentIterator
)
,allTheRest
)
)
Kommentar schreiben
Kristen Weibelt (Montag, 01 Oktober 2018 20:03)
This is such a great post! I have been struggling with this question for quite some time. Can I ask how the sort works? For my file, I need the columns sorted from highest to lowest but have the Other column show last.
tom martens (Montag, 01 Oktober 2018 20:51)
Hey Kristen, I'm glad that you like the post. Regarding your question how the memebers that are shown on the x-axis are sorted. Currently they are not, you can consider this an accident, meaning they are sorted by name :-)
I will publish a new post tomorrow that exactly describes how to create a sorting between two different groups {March, April, May, Jun, Jul} and {Other}.
Basically it's simple, create an index for each member inside a group, add the number of rows from the 1st group to the index of the 2nd group. Make this a measure, add this measure to the tooltip band and now you can sort the members in the chart by this measure. C'est ca!
And once again, thanks for reading.
PreQL (Dienstag, 02 Oktober 2018 17:03)
Your pbix file seems to only be a .PNG
Johanna (Freitag, 23 November 2018 12:13)
Hi,
the Measure is working quite well in my file. Thanks for the help.
Now wanted to see more details, so I added a new cloumn "Citiys" from Table1.
ID is "Coutomer" in my file, I wanted to show the Amount of the Top 3 Customer and Rest with all their Citys.
On the highest Level everythig is still working perfectly, but when i drill down the Matrix the Top3 an Rest is not working anymore. The result is I get all Customers.
Thanks for your help.
Johanna
jsudhakaran (Dienstag, 08 Oktober 2019 20:32)
Amazing.....
Can't thank enough...spend 4 days trying to create a donut chart with the concept. Other methods wouldn't work as all the logic is still in measures and measure can't be a legend on the donut. The intersect worked.
thanks
Jeena
Magnus Windsor (Donnerstag, 24 September 2020 16:00)
Thanks this helped a lot with a very common request!
I was wondering if it's possible to add a second category - so along with the 'top 5' and 'other' groups, we could also do a 'total' category?
For example, in order to display the growth of the top 5 competitors, the growth of the everything else (i.e. not top 5), but then also display an overall market growth.
Thanks for a great piece of work.
Magnus
Magnus Windsor (Freitag, 25 September 2020 17:59)
To my questions above, yes, it works. You just need to add the additional rows to your iterator table / union. Then adjust the If statement.
Terje (Donnerstag, 03 Dezember 2020 09:58)
Hi,
This was a really good walkthrough! Thanks!
I was wondering how you do the sorting! (not by tooltip, but in a table. I want it to sort by name but always put the "others" in the bottom.
HenDog (Dienstag, 27 September 2022 11:56)
Wow I've been at this for a week and just found your post.....Thank you so much