I consider the gateway an unnoticed hero whose presence is only noticed when he is absent, and then your users will see that one of their datasources is offline (not reachable):
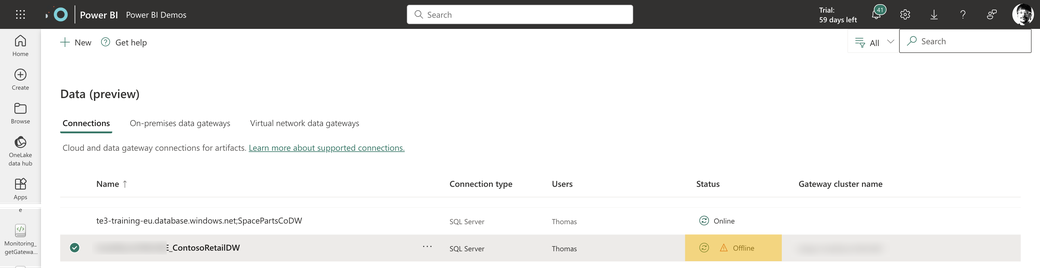
No matter what, when the on-premises gateways are not working as expected, data will not refresh, and direct query queries will not succeed. For this reason, I consider it a good idea to track the well-being of these valuable resources. This article describes a solution built with Microsoft Fabric. It’s not necessary to use Fabric, and it’s also not necessary to build a solution on your own. If you want to track the well-being of your on-premises data gateways but do not want to build something, I recommend using the solution by Rui Romano you can find here: https://github.com/RuiRomano/pbigtwmonitor
I built this monitoring solution focusing on the well-being of the on-premises data gateway. I might extend this solution in the future, but for now, it’s about the availability of the on-premises data gateway and the data gateway connections. Availability and analysis will follow during the next weeks.
Requirements and tooling
I use Microsoft Fabric because I do not have to care about getting access to many different Azure resources. I only need a Microsoft Fabric-enabled workspace and a Service Principal. While the components of Microsoft Fabric are automatically available when using a Microsoft Fabric-enabled workspace, I have to take care of the Service Principal. Having easy access to notebooks (for Python coding), pipelines (for orchestration and automation), a lakehouse (for data storage), and, of course, Power BI makes the promise of an integrated SaaS data analytics platform come true. While I cover the Microsoft Fabric components on the go, I want to mention two resources explicitly. These resources are the Power BI REST APIs and the Service Principal.
Power BI REST APIs
For tracking the well-being of the on-premises data gateway(s), I use the REST API endpoint gateways described here: https://learn.microsoft.com/en-us/rest/api/power-bi/gateways/get-gateways. Later, I will extend this solution to
other REST APIs from the gateway group.
I consider monitoring the Power BI environment a good idea, so I consider using the Power BI REST APIs essential. But the REST APIs are not only useful when you want to monitor your Power BI tenant. They also help in automating tasks like workspace creation and many more
Service Principal
Since I started my journey as a Power BI Sherpa, and now being a Fabric Sherpa, I must learn some things I did not care about when I started this journey. Not to say, I didn’t even know some of these things existed. One of these things is the so-called Service Principal. For this reason, here is my explanation:
A Service Principal is an identity with permissions to access Azure-based resources.
This identity is also called an Azure Active Directory Application. Be aware that Azure Active Directory is now called Azure Entra ID.
One of my problems with the above was (and sometimes still is) the term application. After all, I never thought one of my notebooks was an application for a long time because some only had less than 10 lines of Python code. Basically, everything that’s being executed can be considered an application. A pipeline, a notebook, a dataflow, everything we build and want to be executed unattended is an application. Unattended is crucial because we can not (or won’t) always enter a password. Unattended authentication and authorization require some extra thought.
You can read about the creation of a Service Principal in this article: https://learn.microsoft.com/en-us/power-bi/developer/embedded/embed-service-principal?WT.mc_id=DP-MVP-5003068. From my experience, it’s always a good idea to add the Service Principal to an Azure Active Directory (Azure Entra ID) security group, the reason for this is simple, sometimes (maybe most of the time) it’s not possible to provide permissions to the Service Principal directly inside Power BI. Instead, permissions can only be granted via an Azure Entra ID security group.
The following image shows the difference between authentication and authorization:
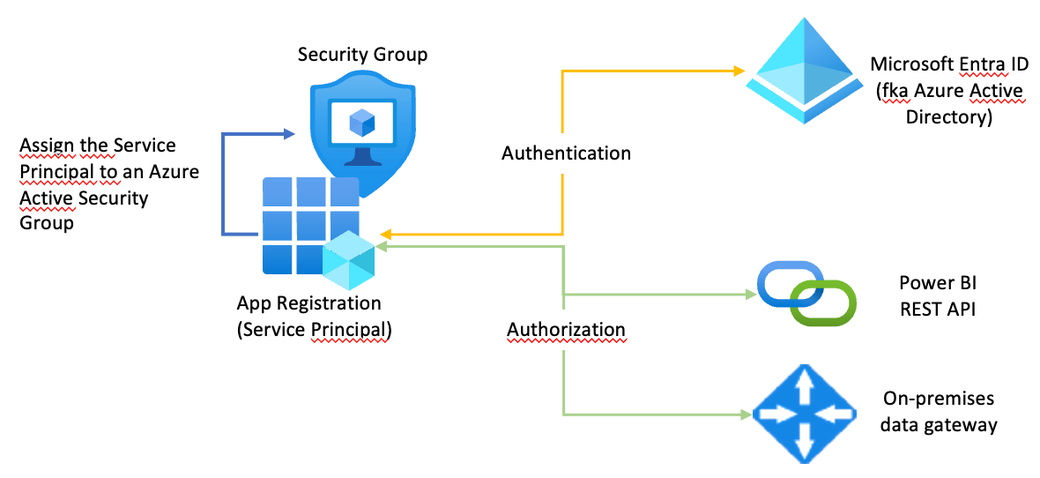
This article describes how authentication works in great detail: https://learn.microsoft.com/en-us/analysis-services/tom/tom-pbi-datasets?view=asallproducts-allversions
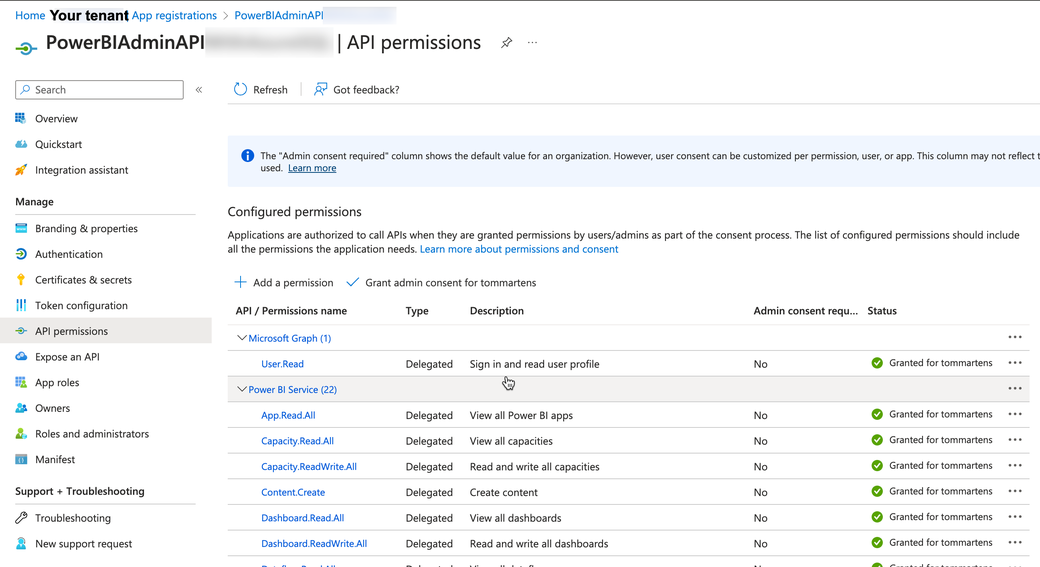
There are many Power BI REST APIs, but not all are required to succeed with a given task. For this reason, you can allow specific REST APIs to be executed by a service principal. This assignment is done in the API permissions blade of the service principal, this is shown in the following visualization:
The following image shows how you allow the execution of Power BI REST APIs by the security group the Service Principal is assigned to:
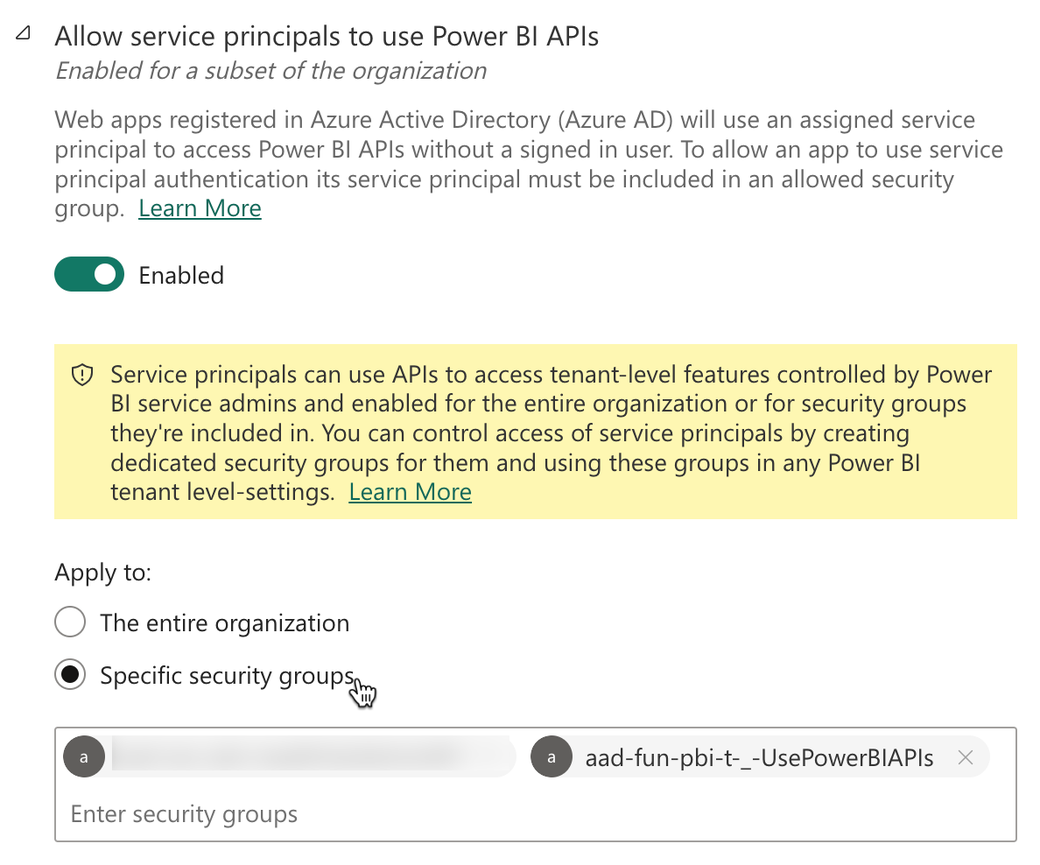
Using security groups instead of adding the service principal directly is always a good idea.
Granting permissions to a service principal should always follow the concept of least privileges. Following this concept leads to the creation of multiple service principals. This means you need documentation of the service principals you allow access to the APIs of your service - the Power BI Service. However, documentation of the various service principals is a different topic.
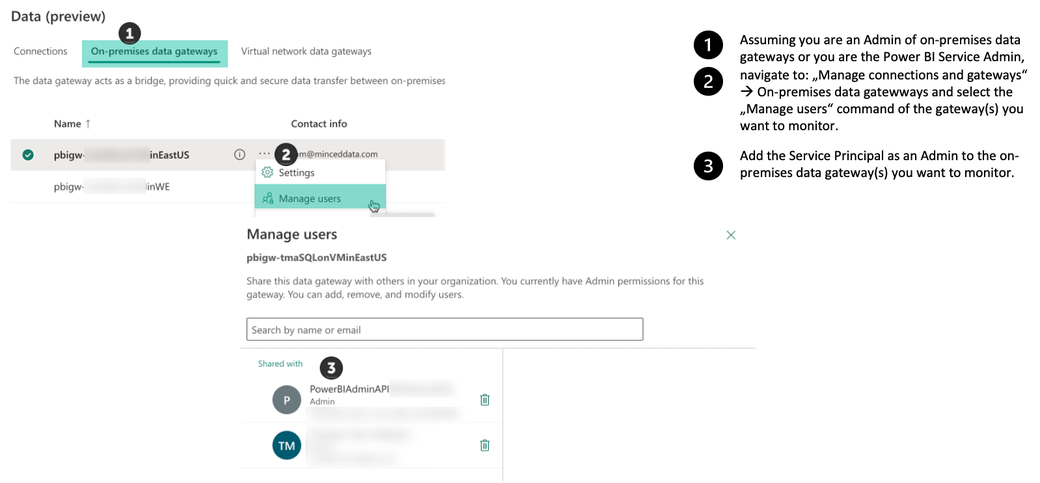
The following image shows how you add the Service Principal (not the security group, this is only for demonstration purposes) as an Admin to the on-premises data gateway(s) you want to monitor, the second resource that requires authorization next to the REST API.
Monitoring the availability of your on-premises data gateway using Microsoft Fabric
Hmm, this is where fun happens. This is the first time that the artifact I publicly share is not a pbix file but Python code. Here, you will find the notebook “tenantMonitoring_gateways.ipynb” (https://tommartens-my.sharepoint.com/:u:/g/personal/tom_minceddata_com/EaxaEdtqMo5FvUdSstAAuoEBmo2PUYj4kXdqEqLCjoFUhA?e=MrF5eU).
The notebook contains inline documentation, and reflects also some of my Python learning.
Maybe now is a good time to get Visual Studio Code. If you want to develop your Microsoft Fabric notebooks using Visual Studio Code, this is the article that will explain everything you need: https://learn.microsoft.com/en-us/fabric/data-engineering/setup-vs-code-extension#install-the-extension-and-prepare-your-environment?WT.mc_id=DP-MVP-5003068
If you are a Python ninja, please excuse my Python code. Currently, my Python foo is not as strong as my DAX foo.
Basically, the current solution is simple: I have a Fabric-enabled workspace, a lakehouse, and a notebook, but the solution will grow during the next iterations.
The following image is showing the current state (October 2023) of my architecture:
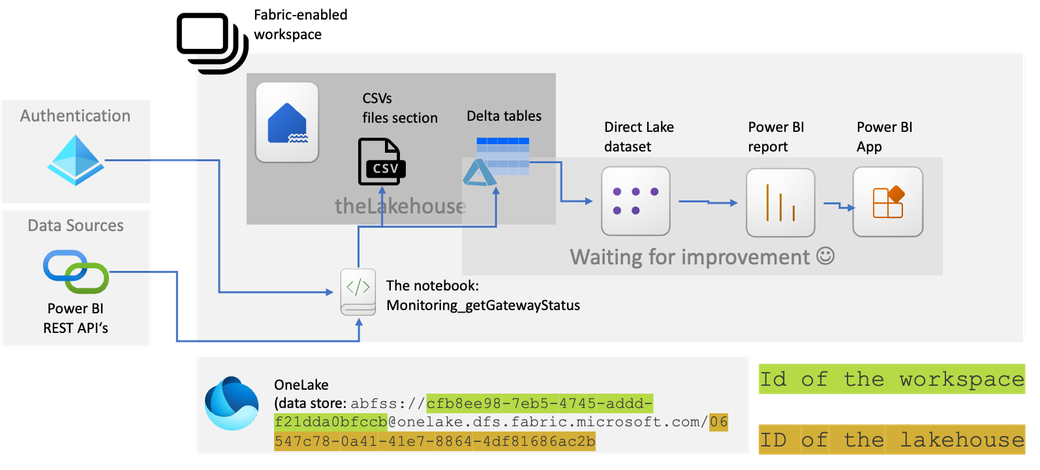
Inside the lakehouse, I created a subfolder “GatewayInformation,” inside the files section. This is the place where I store the result of a REST API endpoint request as a CSV file, of course, after some data transformations. I write the same dataframe (almost the same) that I have written as CSV also as a table in delta format using the vorder sorting.
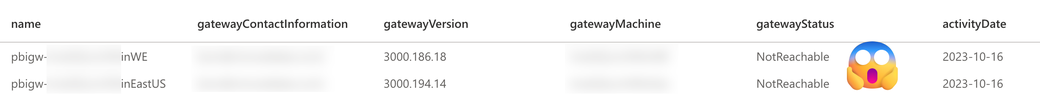
The dataframe will look like this:
Creating this solution was straightforward but not simple because I had to look up some Python code. The simple things are because everything I need comes with the Fabric workspace. The not-so-simple things are because of my Python foo. I assume that the most complicated thing (be aware that this is not the same as complex) might be requesting the Service Principal with the required API Permissions.
The next iteration of this solution will contain the data sources and some Power BI data visualization.
Thank you for reading!
Kommentar schreiben
Jorge Esteves (Mittwoch, 18 Oktober 2023 11:17)
I did appreciate the excellent pace and detail of your explanation.
I will continue to follow up next steps.
Very well...Thanks, Tom!
Tom Martens (Mittwoch, 18 Oktober 2023 13:43)
Hey Jorge, thank you very much for this feedback.