Most of the tables we are using to build our Power BI data models contain at least one, sometimes two, or even more date/datetime columns. Of course, this fact is not surprising because time plays a vital role in our analyses.
Multiple date columns (I tend to call all columns features) in one table pursue different goals like measuring a duration, e.g., the timespan between the placement of an order (order date) and the delivery (delivery date). Multiple date columns (date start and date end) can create a compact representation of events. Often there is an additional column called frequency.
This article focuses on the 2nd aspect mentioned above, the compact representation of events. I have to admit that I'm strict about data modeling (some call this strictness obsession). I'm always looking closely at dimension tables watching for "hidden" events that can be modeled as additional fact tables avoiding complex DAX statements.
This post was inspired by the question "Future payments per contract periodtype" on community.powerbi.com.
Here you will find the pbix that contains my suggested (and accepted) solution.
The Solution
As the sample pbix only contains the calendar and the billing tables, it's not clear if the billing table is also acting as a dimension table or will only play the role of a factless table.
Given the title of the thread, it's simple to discover the event, the payment.
This is the DAX statement I used to create the fact table:
Fact Projection =
var CalendarMax = MAX( 'Calendar'[Date] )
var fact =
SELECTCOLUMNS(
GENERATE(
'Billing'
, var ContractStart = 'Billing'[Begindate]
var ContractEnd = IF(ISBLANK('Billing'[Untildate]) , CalendarMax , 'Billing'[Untildate] )
var MonthUntilContractEnd = DATEDIFF( ContractStart , ContractEnd , MONTH )
var NoOfMonth =
SWITCH(
'Billing'[Period]
, "Month" , 1
, "Quarter" , 3
, "Year" , 12
)
return
ADDCOLUMNS(
GENERATESERIES( 1 , TRUNC( DIVIDE( MonthUntilContractEnd , NoOfMonth ) , 0) + 1 , 1 )
, "Date Projected" , DATE( YEAR( [Begindate] ) , MONTH( 'Billing'[Begindate] ) + ( [Value] - 1 ) * NoOfMonth , DAY( 'Billing'[Begindate] ) )
)
)
, "Contract" , [Contract]
, "Amount" , [Amount]
, "Date Projected" , [Date Projected]
)
return
fact
What happens inside the DAX is this:
- A table is created using GENERATE(…) as the outer iteration across the billing table.
- Each iteration creates a table with payments for a contract using GENERATESERIES(…)
It's important to notice that the most frequent payment is one payment per month in this example. The frequency of payments might be different in other scenarios and impact the above DAX statement as the frequency of payments is determined by two variables (MonthUntilContractEnd and NoOfMonth).
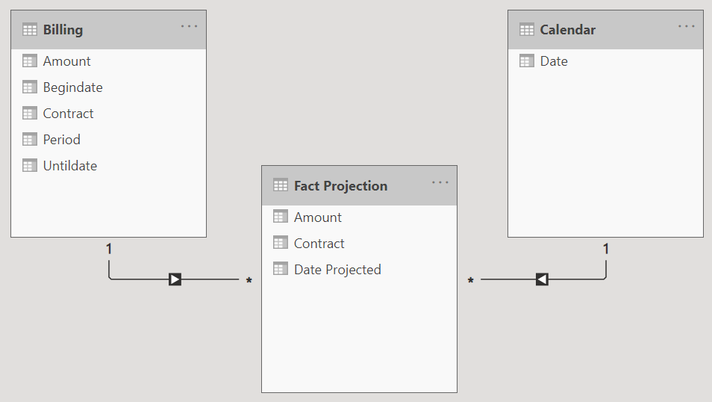
The following picture shows the relationships between the new table "Fact Projection" and the existing tables billing and calendar:
I like to write DAX statements, the more complex, the better. But there is one thing I like more than that, and that is avoiding a DAX statement because of a data modeling solution.
Of course, adding tables to a data model comes with a price, the memory footprint. From my experience, it's always a good idea to try the data modeling approach. Sure, you have to consider the
impact on model size, model refresh duration, and of course, the overall expected data growth, as additional data may decide if your model fits into the 1GB data model size limit of PRO
licensing. On the other hand, no DAX statement can outperform filter propagation.
Thanks for reading, enjoy DAX 😊
Kommentar schreiben
Karen Roets (Freitag, 03 Februar 2023 10:16)
What columns did you use to make the relationships?
Tom Martens (Freitag, 03 Februar 2023 18:05)
I used
'Billing'[Contract} 1-->--* 'Fact Projections'[Contract]
and
'Calendar'[Date] 1-->--* 'Fact Projections'[Date Projected]
Hope this was the expected answer.
Tom