I’m not sure if this will become the start of a new series of articles or if this will only be a single lengthy article.
No matter, the motivation behind this article is that I’m often reading questions about data transformation tasks that have one thing in common, there is a lack of understanding of Power Query’s data structures and how these data structures can be navigated.
Sure, most of the time, a Power Query query represents and, importantly, returns a table that will be used inside Power BI’s dataset. Unfortunately, it’s also very common that data transformations are required before the table can be used with the dataset.
No matter what, after we are connected to one of the many data sources, be it a SharePoint list, an Excel file inside a SharePoint library, a SQL Server database, or some big data store, the first appearance of the connected artifact looks like a table, there are rows and columns.
Explaining the data structures of Power Query requires sample data. For the sake of simplicity, I enter sample data directly into Power BI. This makes it more simple to follow all the aspects I describe in this article. You will find the pbix file here.
The following screenshot shows the sample data I will use throughout this article.
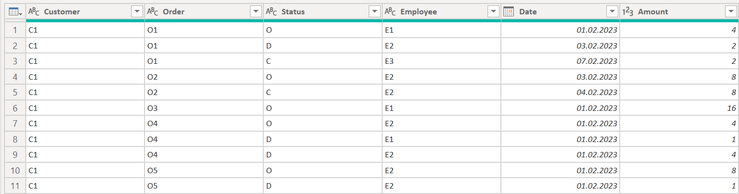
The above table represents the status (column: Status) of an order (column: Order) for a given customer (column: Customer)
In the next two chapters, I share my imagination and my understanding of the thing we call a table in Power Query and share an example of how this understanding helps solving a specific task.
The thing we call a table and other data structures
When we use Power Query connecting to a data source, this will return a table like the one above, a collection of rows and columns ready for all the transformations to shape the table and the data to our liking. At some point in time, we became daring and open the Advanced Editor. We realize that some of the M functions we use for our data transformations come with many curly brackets or square brackets. By now, we understand that the lhs (left-hand side of an equation) of a line is representing a table, whereas the functions on the rhs (right-hand side of an equation) reference the lhs from the previous line. Solving our data transformation challenges sometimes requires us to delve deeper into the realm of M because we need the extra power that adds magic to the powerful point-and-click interface. This is when we start directly interacting with the data structures table, record, or list.
I use the next sections to introduce the data structures list, record, and of course, the table. Please be aware that this is an introductory article. I often hear that this “basic” understanding is helping open a door to new solutions, but please be aware that you might encounter situations where this is not enough. If you encounter such a situation, then read on with Ben Gribaudo’s primer to M: Power Query M Primer | Ben Gribaudo
Lists
Lists are a primitive data structure that is able to store values of different types. The following M code creates a list that stores a numeric value, a list, and also a string value:
let
Source =
{
1
, {"A" , "B"}
, "B"
}
in
Source
The result of the above M code is shown in the next picture:
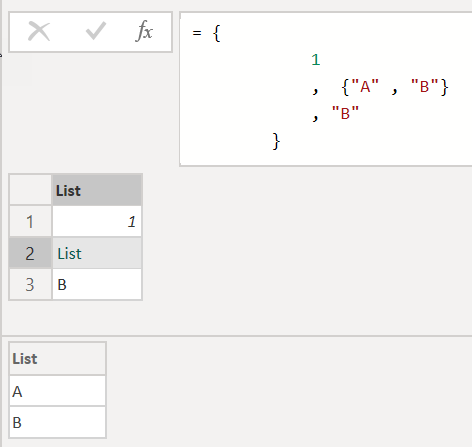
The one thing to notice are the curly brackets, these brackets define a list. But even more important lists are zero-based. If we want to access the second item (the list) of the simple list, we can do this like so:
= {
1
, {"A" , "B"}
, "B"
}{1}
Adding curly brackets with an index returns the corresponding item of the list. This means we can also use curly brackets to navigate a list's content.
Not sure if you ever tried to add the curly brackets to a table, like so:
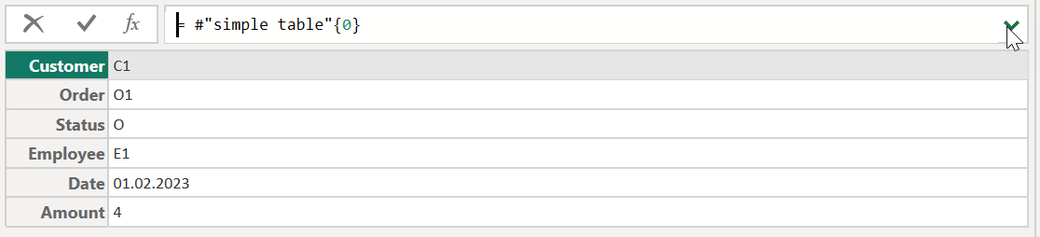
Adding curly brackets with an index to a table returns a record, a record is the second primitive data structure I cover in this article.
Records
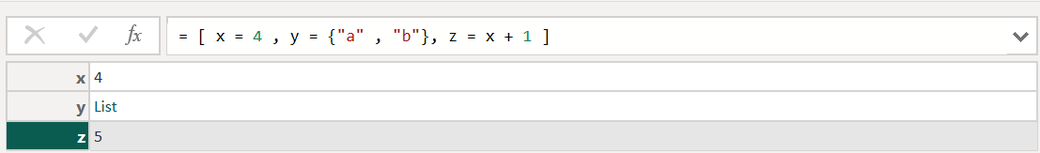
I consider a record being a row where I can specify the name of columns and their values like so:
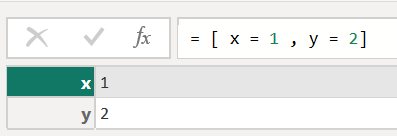
The definition of a record starts with square brackets. When you discover square brackets in some M code, you look at a record. A record is a very powerful data structure. It’s possible to consider a record a complex variable that we can use with more complex functions like List.Generate or List.Accumulate. Next to that, some M functions like Web.Contents require additional parameters in the form of a record.
Similar to a list, the fields of a record can store any type of data. What makes a record special (from my perspective) is the ability to provide a function as a value. The next picture shows an example:
Providing a function as a field “value” is a very powerful capability. I’m sure I will write another article on how this helps solve the most complex data transformation challenges.
But now, back to the basics of a record and how to use square brackets to navigate a table.
When we add square brackets to an existing table like so
#”simple table”[#”Order”]
The result looks like this:
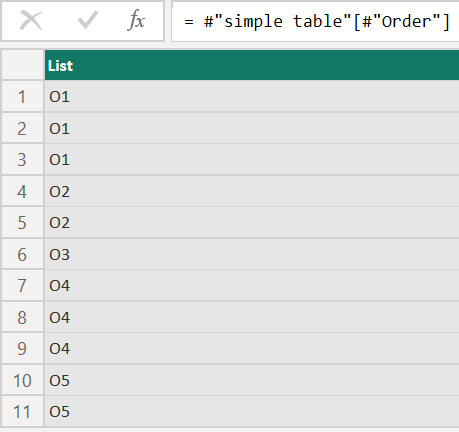
Of course, using this #”simple table”[Order] will return exactly the same result. Maybe I will cover the meaning of the awkward-looking column reference #”…” in a later article.
The essential part here is that square brackets help extract a field from a record and a table. And even more important when using square brackets like so
#”any table”[some column]
the result will be automatically transformed into a list. Using square brackets for field extraction is why square brackets are also called “field selector” or “selection operator.”
If you want to extract more than one column, e.g., the columns Customer and Order, from the sample table, you can do so by using this syntax
#”simple table”[ [Customer] , [Order] ]
The spaces in the above M code are not necessary, I tend to use spaces for better readability.
The result of the above snippet will be of the object-type table. If you want to extract a single column but want to be the result of the object-type table, use this syntax
#”simple table”[ [Order ] ]
Curly brackets and square brackets can be combined even with functions. Assuming I want to extract the value of the column Status from the last record, your code might look like this:
#"simple table"{ Table.RowCount(#"simple table") -1 }[Status]
The -1 is necessary as index-based row navigation is zero-based.
The previous two sections are an introduction to the primitive data structure list and record of Power Query’s M language, now, we are heading to the data structure that is used to form our data model, the table.
Tables
Tables are more than a list of records, but please remember that this is an introductory article, the next image shows what I see when I’m looking at a table inside Power Query.
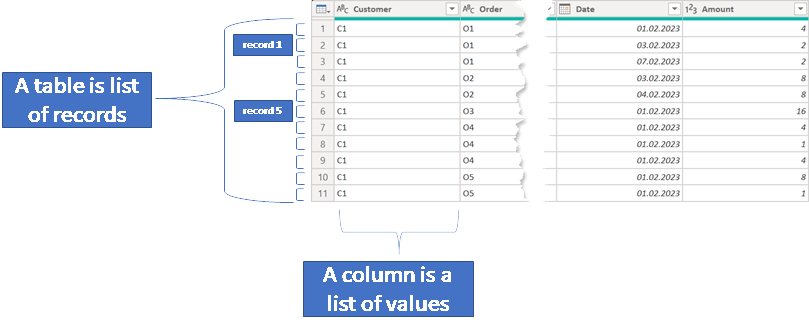
When we are tasked with optimizing a query from a performance point of view, a deeper understanding of query execution is required. This also requires a more intricate view of the table object. But we are not there yet.
Nevertheless, understanding that it’s possible not to say easy to extract lists or records from a table to apply complex transformations easily, this is
because we can leverage the power of all the list and record functions.
I will describe how these functions can apply complex business rules to the table in the next chapter.
Applying a "complex" business rule to a table
The business rule that I want to apply to the sample table reads like this:
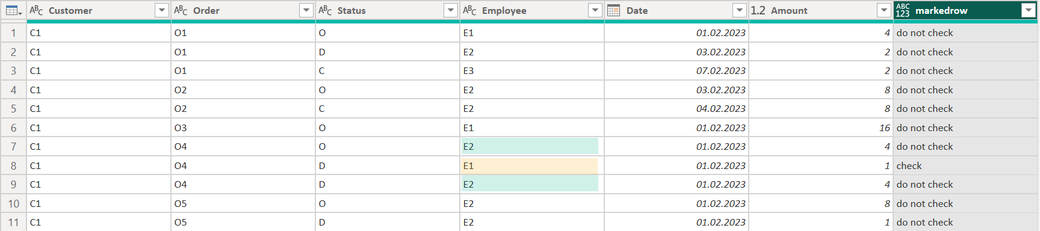
Mark each row in the group of rows (Customer and Order) with "check" where the group does not contain the status C and where the employee of a row with the status D does not match the employee of the row with the status O of the given group.
The next image shows the expected result :
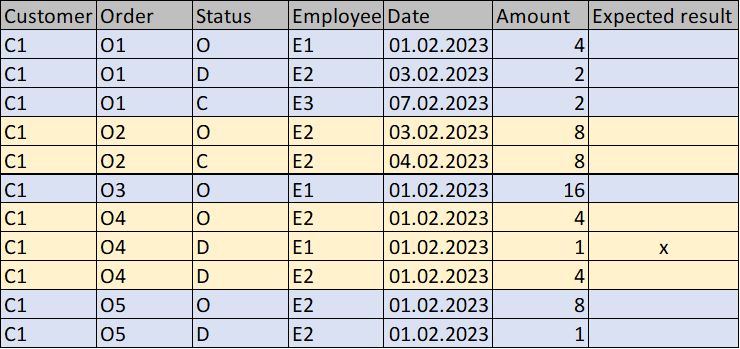
From all the rows only one record will be marked. In the above picture, the different groups are marked with an alternating color for better readability.
I realize that users are struggling with this kind of task because the comparison has to be performed on a row level, but the comparison value comes from a different row inside the same group. Even if this task seems simple compared to applying complex machine learning algorithms, this task cannot be solved w/o some understanding of the M data structures and a little thinking 😉 Hence I wrote this article,
I’m sure many patterns can be applied to achieve the above result. For this reason, I consider my approach one of many. I like this approach because it behaves well even when there are more than 11 rows inside the table.
Solution description
When I’m tasked with a complex transformation, I like to create a list of steps that I want to apply before I start coding; this helps me to stay focused 😉
- Group the rows by Customer and Order
-
Decide if the group might contain a row to be marked – finding groups of interest
- the group does not contain a row with the status c
- the group contains at least one row with the status
- Compare if the Employee(s) of D-rows are different from the employee of the O-row
- Yes – mark the row
- No – do not mark the row
Grouping of rows
One of my favorite functions is Table.Goup.
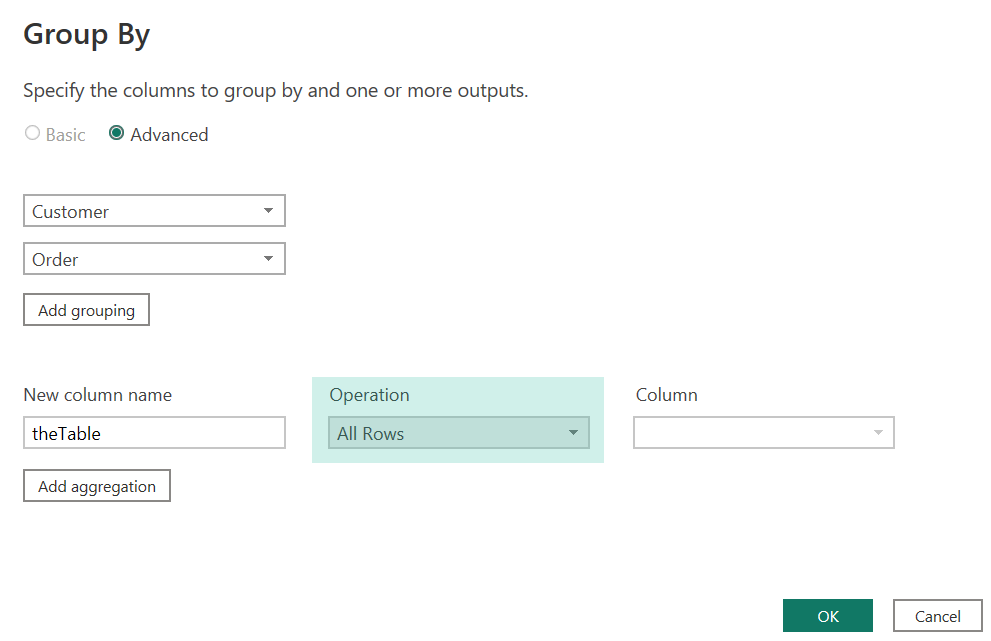
In combination with the operation “All Rows” this function allows the separation of the table into chunks (some might call these partitions). Each chunk still
contains all the columns of the table. The next picture shows the dialog of the Group by method when the columns Customer and Order are marked.
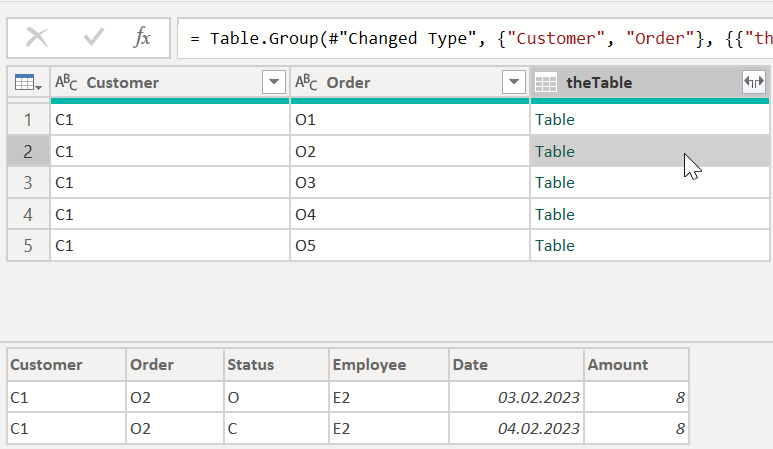
And of the course the result of this operation:
The group of interest
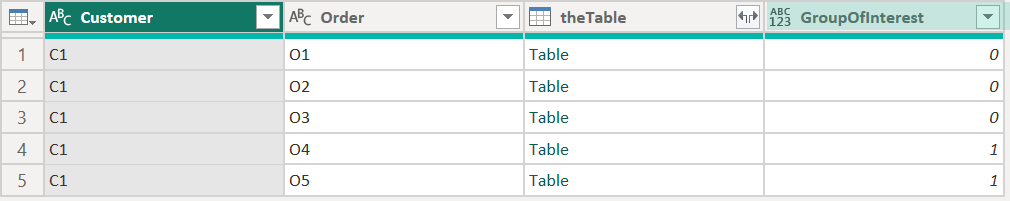
With the knowledge of the first chapter, it is easy to extract the status column for each “nested” table and to decide whether one of the groups might contain a row to be marked. For this purpose, I added a custom column GroupOfInterest that checks the status column of the nested table. If there is no C but a D, the value is 1 otherwise, 0.
Here is the formula of the column
if
List.Contains( [theTable][Status] , "D") and not List.Contains( [theTable][Status], "C")
then 1
else 0
I use the field selector [Status] in combination with the nested table, the table created by the grouping operation, wrapped into the list function List.Contains. The next picture shows the result:
Compare the employees
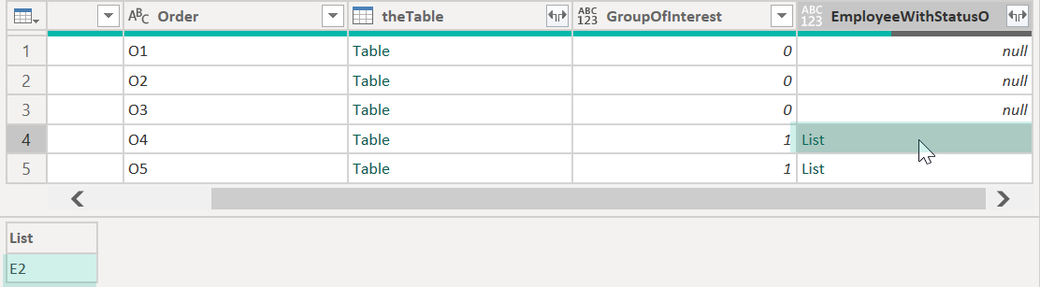
For this I will first create an additional column based on the nested table of the column theTable. This intermediate step is here for better traceability.
In this step, a formula looks for the GroupOfInterest column, if the value is 1, a list is returned that contains the employee(s) otherwise null is returned. The next picture shows the result:
This is the formula that creates the list:
if [GroupOfInterest] = 1
then
Table.SelectRows(
[theTable], each [Status] = "O"
)[Employee]
else null
The function Table.SelectRows filters the rows where the Status equals O, the field selector [Employee] extracts the column Employee and transforms the column values into a List.
Then the nested table is expanded. The table expansion allows the comparison of the row value with a list that contains values from a different row of the same group.
This is the formula:
if [GroupOfInterest] <> 1
then "do not check"
else if List.Contains( [EmployeeWithStatusO] , [Employee] )
then "do not check"
else "check"
And this is the result after the custom columns GroupOfInterest and EmployeeWithStatusO are deleted:
Thank you for reading - enjoy Power BI
Kommentar schreiben