There are a lot of situations where it becomes necessary to reference one particular row or a group of rows that are somehow related by their position to the current row of a table in the Tabular model, no matter if this model resides in SSAS, in Power Pivot, or Power BI.
But unfortunately this is not that easy, as it is in Excel, where we can use relative or absolute cell references. And another very important fact that we always have to keep in mind, a row in a table is not aware of its own position in the table.
One question that surfaces quite often in the Power BI community (community.powerbi.com) also in different forms, is a question like this: "What is the previous value of …"
Please keep in mind, that the task to answer this question can become quite difficult, depending on the nature of your table and how the rows are organized (meaning ordered) inside this table.
The PBIX file that contains the data, can be found here
The naive approach
What makes this approach naïve is the fact that a previous value (I'm focusing on going backwards in time) can be always determined without the need to consider user interactions (meaning using slicer). Here I'm using a table that in some way reflects a product catalog, this table may look like this:

The table above shows price adjustments for some products over time.
To answer the question "What is the previous price?" some steps are necessary:
- Create an Index column for each group of products
- Create a calculated column shat shows the previous price of a product
Creating an Index column for rows grouped by a product
Now it's more or less easy to create an index column for each product ordered by the PriceDate column. The result will look like this:

To achieve this I use the query editor
Transform --> Group by

The name I provided as "New column name" is not important because it will not surface but it's mandatory to use the Operation: All Rows.
After hitting "OK" I will receive this table:

The formula bar now contains this M expression for the Group by step:
Table.Group(#"Changed Type", {"Product"}, {{"RowIndexInGroup", each _, type table}})
I'm interested in the _, because this underscore represents each group (the group has the form of a table). To create an Index for each group I tweak this formula by replacing the underscore by the following formula:
Table.AddIndexColumn( Table.Sort(_, {{"PriceDate", 0}} ) , "RowIndexInGroup" ,1,1 )
This Formula adds an IndexColumn to each table, whereas the the table is ordered by the column Pricedate. The arguments of the function "Table.AddIndexColumn" are, table, name of the new Indexcolumn, the value to start with, the increment.
Please be aware: After adjusting the original formula, the Group by Dialog will not be open any longer :-)
I can expand the table and get a table that contains an index for each product group:

Before creating a calculated column that shows the previous price I change the data type of the column "RowIndexInGroup" to "Whole number" and also check the data types of all other columns that have been used inside the Group By :-)
Creating a calculated column
This DAX statement now creates a column that shows the previous price:
Previous Price =
LOOKUPVALUE(
'ProductCatalog'[Price]
,'ProductCatalog'[Product],'ProductCatalog'[Product]
,'ProductCatalog'[RowIndexInGroup.1],'ProductCatalog'[RowIndexInGroup.1] -1
)
The final result of my table now contains a column that shows the previous price:

The not so naive approach
Sometimes, from my experience most of the time, the naïve approach can't be used, because it's not possible to rely on a unique row identifier, because the row numbering will change due to interaction of the user with slicers, leading to not contiguous values in the filtered table.
In this case I use the following approach. Because due to my experience that most of the time I'm looking for a certain value at previous point in time, I will use some date / time related wording, but of course this can be adapted to any question, as long as it's possible to order the dataset.
- Determine the current date
- Determine the latest date before the current date - the previous date
- Determine the value of interest at the previous point in time
This approach is solely using measures, there may also be solutions that to some extent can also use calculated columns, but due to the fact that I'm currently facing really large tables I'm trying to avoid the additional footprint of calculated columns. And I'm sure that the solutions presented here can be optimized for certain scenarios.
My Power BI Desktop file that I'm using here is using sampledata. This sampledata is created by the DAX function GENERATESERIES(…). For this reason you may encounter different values, but this approach allows (at least to some extent) to scale the number or rows used in the tables. This gives me some clue how my calculations behave if the table size grows.
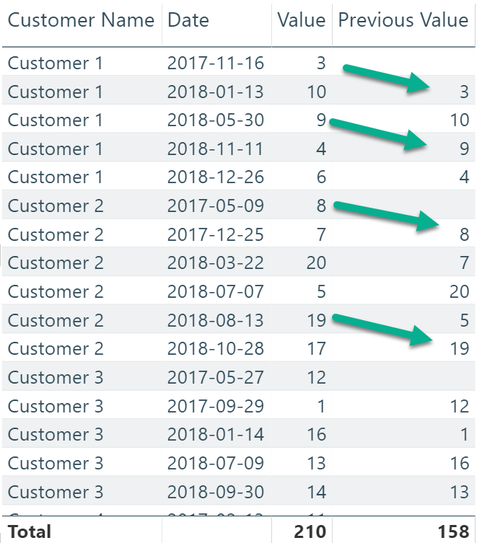
I'm starting with this table:

And want to achieve this:
Here is my the DAX statement to create the values for the measure Previous Value:
Previous Value =
SUMX(
'Simple Facts'
,var thisCustomer = 'Simple Facts'[Customer]
var thisTransactionDate = 'Simple Facts'[TransActionDate]
var thisPrevTransactionDate = CALCULATE(
MAX('Simple Facts'[TransActionDate])
,FILTER(ALL('Simple Facts')
,'Simple Facts'[Customer] = thisCustomer && 'Simple Facts'[TransActionDate] < thisTransactionDate
)
)
var thePreviousValue = CALCULATE(
SUM('Simple Facts'[Value])
,FILTER(ALL('Simple Facts')
,'Simple Facts'[Customer] = thisCustomer && 'Simple Facts'[TransActionDate] = thisPrevTransactionDate
)
)
return
thePreviousValue
)
I'm using SUMX to also create a value for the SutTotal line in the Table Visual
Enjoy
Tom
Kommentar schreiben
Hans Moss (Mittwoch, 01 Mai 2019 06:58)
Beautifully explained and executed. Thanks a lot of sharing your knowledge.
Dan Paul (Mittwoch, 14 August 2019 17:59)
The formula bar now contains this M expression for the Group by step:
Thanks for this... It is the closest I have come to solving a big issue for me. But in the instructions it says that after I create my RowIndexGroup I should see this in the 'M' code.
Table.Group(#"Changed Type", {"Product"}, {{"RowIndexInGroup", each _, type table}})
I don't see this. I see this: = Table.Group(Source, {"Identifier"}, {{"RowIndexGroup", each _, type table [Query=number, Identifier=number, DocumentId=number, EnrollmentId=number, ProgramStatusCode=text, ProgramStatusDescription=text, ParkId=number, U
My 'Group By Column' is called 'Identifier' where there can be one to many identifiers across the rows. (Same as you 'Product Name'. and my index column is EnrollmentId where each identifier can have 1 to many EnrollmentId's. When I replace the '_' with Table.AddIndexColumn( Table.Sort(_, {{"EnrollmentId", 0}} ) , "RowIndexInGroup" ,1,1 ) I do not get the correct result. I do not see Identifier 1, Index 1,2,3 when Identifier 1 has 3 enrollments.
Any hints?
Dan Paul (Mittwoch, 14 August 2019 18:45)
Further Comment. I just noticed. Table.AddIndexColumn( Table.Sort(_, {{"PriceDate", 0}} ) , "RowIndexInGroup" ,1,1 ) i s supposed to add a column called 'RowIndexInGroup' to each row. It is not doing this. What am I missing?