Data Visualization · 16. Mai 2022
Field parameters allow the report designer to switch the content of a visual with ease. This feature allows the report consumers to interact with data without needing to create their reports
Data Modeling · 24. April 2022
One of the powerful features of the Tabular data model is to extend the model by adding calculated columns and measures. Both objects are defined using DAX, but besides this similarity, they are entirely different beasts. Here you will find guidance when to use what!
Data Modeling · 23. Februar 2022

The concept of extended tables is at the core of the query performance of Power BI datasets, but it is often overlooked. This article will hopefully change this.
Data Modeling · 20. Januar 2022

This article explains provides an introduction to relationships and why relationships can be considered a sword that helps to chop vast amounts of data into tiny pieces.
Data Modeling · 27. Dezember 2021

Data modeling and understanding the physical layer are comparable with being a good driver and a good car mechanic. It's unnecessary to excel in both areas. Still, it helps tremendously when driving an F1 car through uncharted terrain if there is some understanding of how an F1 car works if repair becomes necessary.,
DAX · 26. Dezember 2021
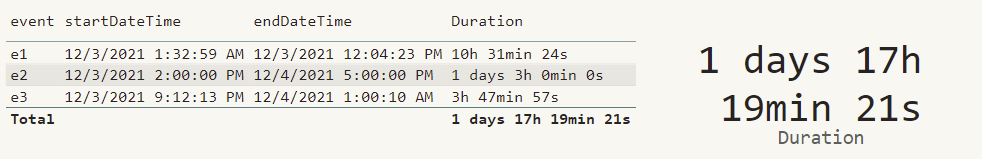
This article is about durations.
When we are looking at something like this: 2:00
We think, at least most of the people I know, an event that takes 2 hours.
But when we change the notation just a little to 2:00 AM, we think: Whoa, that’s early (or late, depending on the perspective, of course).
Data Visualization · 03. April 2021
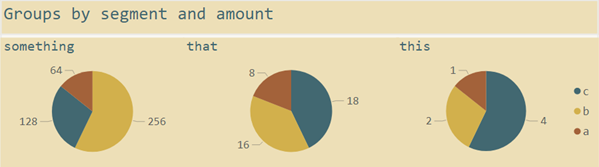
This blog is about one visualization task. In particular, this task is called part-to-whole. Effective visualizations will reveal the contribution of a single item to the whole, as Claus Dieter Wilke calls this in his book "Fundamentals of Data Visualization": "… visualizing proportions … as part of the total." and how this task can be solved using Power BI, now and even more important in the future.
Data Modeling · 28. Februar 2021

Object Level Security (OLS) helps to protect our data assets inside Power BI. OLS can be applied to a table or just a single column.
Power BI Service · 29. November 2020

This is the start of a series of articles that explain why the Power BI service admin can be considered being an agent of change helping enterprises becoming a data-enabled organization.
DAX · 02. November 2020

This article will provide a different approach to tackle a common requirement, determining the previous value given a current date.